Breakdown dimensions
Breakdowns in the reporting API are useful when you want to see the cross-product of values from two different dimensions. When requesting a breakdown report, use the metricsFilters and dimension parameters to request the additional dimension.
The following example requests a breakdown report containing a list of the top five "Internal Search Terms" used by visitors who saw campaign 10. Within the metricsFilters parameter, the type is set to breakdown (line 21), and evar1 is the marketing campaign (line 22). Within the dimensions parameter, evar2 is the "Internal Search Terms" (line 27).
Adobe may add optional request and response members (name/value pairs) to existing API objects at any time and without notice or changes in versioning. Adobe recommends that you refer to the API documentation of any third-party tool you integrate with our APIs so that such additions are ignored in processing if not understood. If implemented properly, such additions are non-breaking changes for your implementation. Adobe will not remove parameters or add required parameters without first providing standard notification through release notes.
If the text value of item is already known, it can be passed inside the metricFilter object as itemValue field (Make sure to pass the exact text value). For example, instead of passing the item id "itemId":"743855946" of the item "Campaign 10", we can pass the text value of the item like this "itemValue" : "10" Passing an item value instead of item id will result in slightly slower performance, but it will be useful in preventing multiple reporting calls to retrieve item ids.
Copied to your clipboard{"rsid":"examplersid","globalFilters":[{"type":"dateRange","dateRange":"YYYY-12-31T00:00:00.000/YYYY-01-06T23:59:59.999"}],"metricContainer":{"metrics":[{"columnId":"0","id":"metrics/pageviews","filters":["0"]}],"metricFilters":[{"id":"0","type":"breakdown","dimension":"evar1","itemId":"743855946"}]},"dimension":"variables/evar2","settings":{"dimensionSort":"asc","limit":5}}
Copied to your clipboard{"totalPages":2,"firstPage":true,"lastPage":false,"numberOfElements":5,"number":0,"totalElements":7,"columns":{"dimension":{"id":"variables/evar2","type":"string"},"columnIds":["0"]},"rows":[{"itemId":"1132341824","value":"red t-shirt","data":[1515.0]},{"itemId":"2400044733","value":"digital watches","data":[1.0]},{"itemId":"3351316813","value":"sport socks","data":[11.0]},{"itemId":"3440395251","value":"gps watch","data":[95.0]},{"itemId":"3614317595","value":"running shoes","data":[16.0]}],"summaryData":{"totals":[2032.0]}}
Multi-level breakdowns
Multiple level breakdowns with the Reports API is helpful for visualizing the cross-product of values from three or more dimensions.
For example, if you create an interactive map to explore product sales by campaigns and regions, the Reports API can dynamically update the map as new data becomes available. This allows team members to select different map locations from which they can view the current campaigns and product sales for the region.
In the following example, these levels are used:
- Top level: Visualize the
Daydimension filtered by thePage ViewsandVisitsmetrics. - Second level: Visualize the previous level of data after a specifying a
Dateand applying thePagedimension. - Third level: Visualize the previous two levels of data after applying the
Citiesdimension to a specified page.
For each level of the breakdown report below, a sample JSON request and response is provided.
Top level report
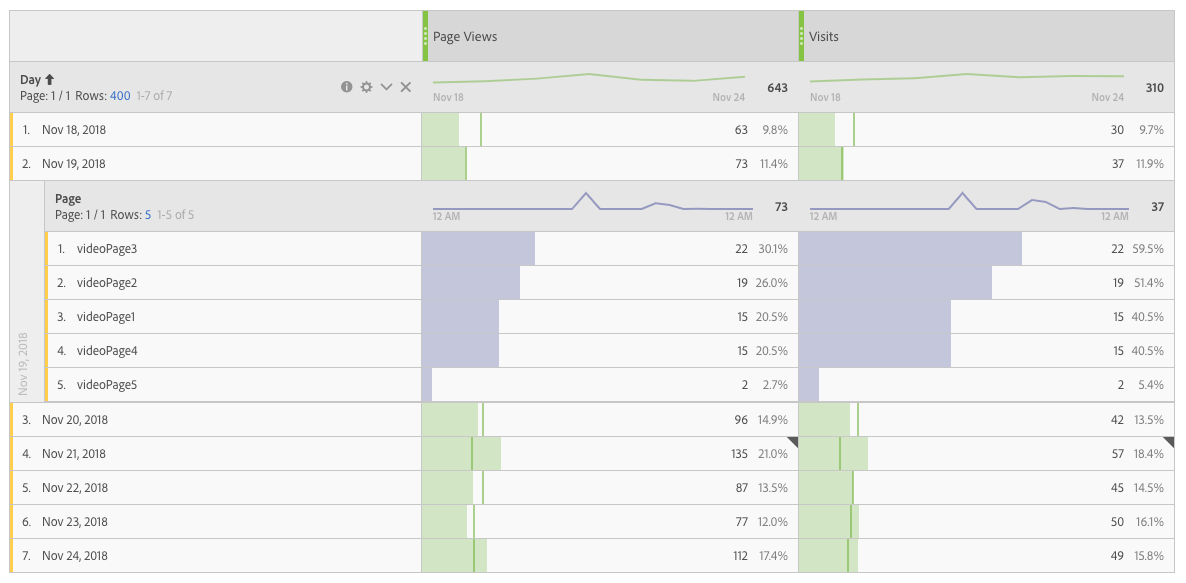
The top level report in the following example shows the dimension Day and includes the metrics Page Views and Visits. The date range is set to the week of November 18, 2018.

Top level request
The JSON message request body for this report request follows:
Copied to your clipboard{"rsid": "examplersid","globalFilters": [{"type": "dateRange","dateRange": "YYYY-11-18T00:00:00.000/YYYY-11-25T00:00:00.000"}],"metricContainer": {"metrics": [{"columnId": "0","id": "metrics/pageviews"},{"columnId": "1","id": "metrics/visits"}]},"dimension": "variables/daterangeday","settings": {"countRepeatInstances": true,"limit": 400,"page": 0,"dimensionSort": "asc"}}
Copied to your clipboard{"totalPages": 1,"firstPage": true,"lastPage": true,"numberOfElements": 7,"number": 0,"totalElements": 7,"columns": {"dimension": {"id": "variables/daterangeday","type": "time"},"columnIds": ["0","1"]},"rows": [{"itemId": "1181018","value": "Nov 18, YYYY","data": [63,30]},{"itemId": "1181019","value": "Nov 19, YYYY","data": [73,37]},{"itemId": "1181020","value": "Nov 20, YYYY","data": [96,42]},{"itemId": "1181021","value": "Nov 21, YYYY","data": [135,57]},{"itemId": "1181022","value": "Nov 22, YYYY","data": [87,45]},{"itemId": "1181023","value": "Nov 23, YYYY","data": [77,50]},{"itemId": "1181024","value": "Nov 24, YYYY","data": [112,49]}],"summaryData": {"totals": [643,310]}}
Second level breakdown
For the second level, you can break down a specific date by the Page dimension. In order to do this, note the previous JSON response for the Nov 19, 2018 date:
Copied to your clipboard"itemId": "1181019","value": "Nov 19, 2018","data": [73,37]
The response shows itemId 1181019, so we will use that in our report request below.

Second level request
The JSON message request body for this report request looks like the following. Note that the metricFilters attribute in the request contains a metric filter that corresponds to a metric in the metrics attribute of the request. Each metric has a filters array that applies metric filters to the metric column. In this example, we are applying metric filter 0 to the Page Views metric column and metric filter 1 to the Visits metric column.
Copied to your clipboard{"rsid": "examplersid","globalFilters": [{"type": "dateRange","dateRange": "YYYY-11-18T00:00:00.000/YYYY-11-25T00:00:00.000"}],"metricContainer": {"metrics": [{"columnId": "0","id": "metrics/pageviews","filters": ["0"]},{"columnId": "1","id": "metrics/visits","filters": ["1"]}],"metricFilters": [{"id": "0","type": "breakdown","dimension": "variables/daterangeday","itemId": "1181019"},{"id": "1","type": "breakdown","dimension": "variables/daterangeday","itemId": "1181019"}]},"dimension": "variables/page","settings": {"countRepeatInstances": true,"limit": 5,"page": 0}}
Copied to your clipboard{"totalPages": 1,"firstPage": true,"lastPage": true,"numberOfElements": 5,"number": 0,"totalElements": 5,"columns": {"dimension": {"id": "variables/page","type": "string"},"columnIds": ["0","1"]},"rows": [{"itemId": "364325780","value": "videoPage3","data": [22,22]},{"itemId": "2095855582","value": "videoPage2","data": [19,19]},{"itemId": "2770622699","value": "videoPage1","data": [15,15]},{"itemId": "2519319590","value": "videoPage4","data": [15,15]},{"itemId": "4240790753","value": "videoPage5","data": [2,2]}],"summaryData": {"totals": [73,37]}}
Third level breakdown
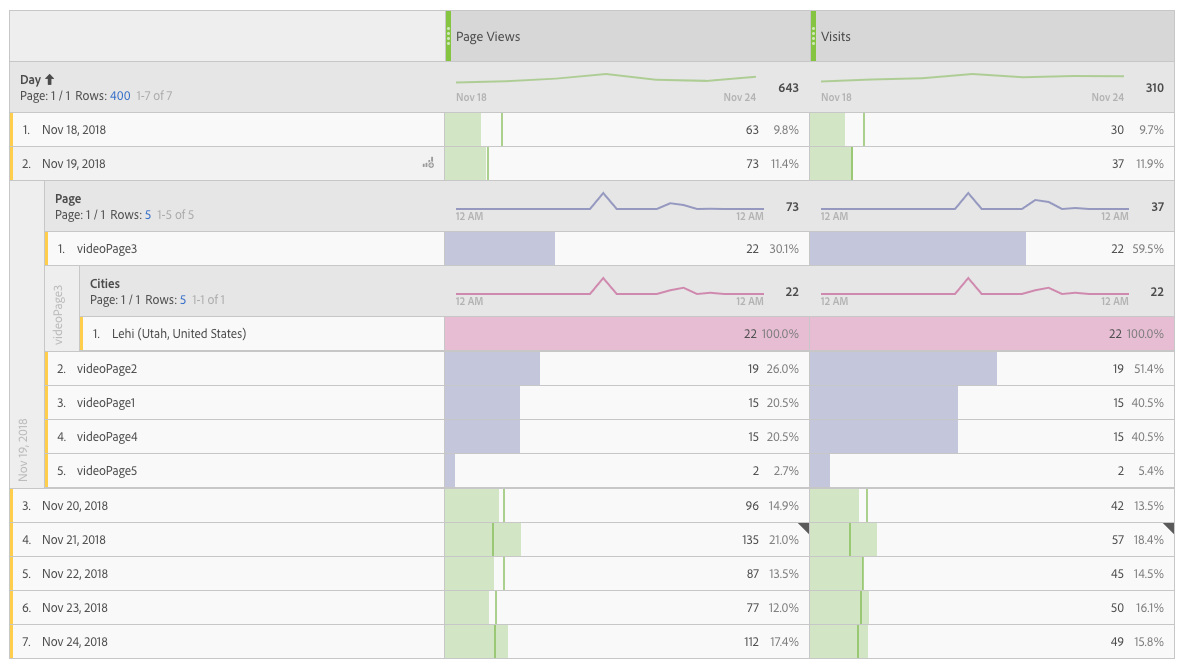
The third level of the example shows how to further break down the report by applying the Cities dimension to the page videoPage3. To do this, we use the itemId of the row containing VideoPage3 in the second level response, which is 364325780. Note the value in the request below:

Note that there are now 4 metric filters in the metricFilters array of the request. Filters 0 and 2 are applied to the Page Views metric column, and filters 1 and 3 are applied to the Visits metric column.
Copied to your clipboard{"rsid": "examplersid","globalFilters": [{"type": "dateRange","dateRange": "YYYY-11-18T00:00:00.000/YYYY-11-25T00:00:00.000"}],"metricContainer": {"metrics": [{"columnId": "0","id": "metrics/pageviews","filters": ["0","2"]},{"columnId": "1","id": "metrics/visits","filters": ["1","3"]}],"metricFilters": [{"id": "0","type": "breakdown","dimension": "variables/daterangeday","itemId": "1181019"},{"id": "1","type": "breakdown","dimension": "variables/daterangeday","itemId": "1181019"},{"id": "2","type": "breakdown","dimension": "variables/page","itemId": "364325780"},{"id": "3","type": "breakdown","dimension": "variables/page","itemId": "364325780"}]},"dimension": "variables/geocity","settings": {"countRepeatInstances": true,"limit": 5,"page": 0}}
Copied to your clipboard{"totalPages": 1,"firstPage": true,"lastPage": true,"numberOfElements": 1,"number": 0,"totalElements": 1,"columns": {"dimension": {"id": "variables/geocity","type": "enum"},"columnIds": ["0","1"]},"rows": [{"itemId": "3113581109","value": "Lehi (Utah, United States)","data": [22,22]}],"summaryData": {"totals": [22,22]}}


